

Next: 6.2 Approximation
Up: 6. Limits of Sequences
Previous: 6. Limits of Sequences
Index
6.1
Definition (Absolute values.)
Recall that
if

is a real number, then the
absolute value of 
, denoted by

, is
defined by
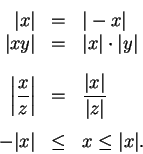
We will assume the following properties of absolute value, that follow easily
from
the definition:
For all real numbers  with
with 
For all real numbers  , and all

and
 |
(6.2) |
We also have
and
6.3
Theorem.
Let
 and let
 . Then for all
 we have
and
Equivalently, we can say that
and
Proof: I will prove only the first
statement. I have
6.4
Definition (Distance.)
The
distance between two
real numbers

and

is defined by
Theorem 6.3 says that the set of numbers whose distance
from  is smaller than
  is the interval
  . Geometrically
this is clear from the picture.
I remember the theorem by keeping the picture
in mind.
Proof
For all  and
and  in R we have
and
so
Hence (Cf. (6.2))
6.7
Exercise.
Can you prove that for all

?
Can you prove that for all
 ?
?
Remark:
Let  be real numbers with
  and
and  .
.
Then
This result should be clear from the picture. We can give an analytic
proof as follows.
6.8
Examples.
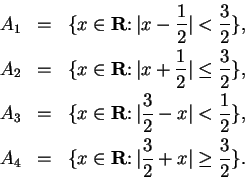
Let
Then a number

is in

if and only if the distance from

to

is smaller than

, and

is in

if and only if the distance
from

to

is greater than

. I can see by inspection that
and
Let
If

, then

is in

if and only if

, i.e. if and only if

is closer to

than to

.
I can see by inspection that the point
equidistant from

and

is

, and that the numbers that are
closer to

than to

are the positive numbers, so

.
I can also do this analytically, (but in practice I wouldn't)
as follows. Since the alsolute values are all non-negative
6.9
Exercise.
Express
each of the four sets below as an interval or a union
of intervals. (You can do this problem by inspection.)
6.10
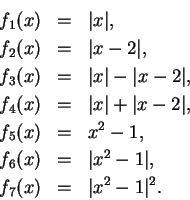
Exercise.
Sketch the graphs of the functions from

to

defined by the
following equations:
(No explanations are expected for this problem.)
6.11
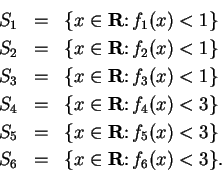
Exercise.
Let

be the functions described in the
previous exercise. By looking at the graphs, express each of the
following six sets in terms of intervals.
Let

. Represent

graphically on a number line.
Remark: The notation  for absolute value of
  was introduced by
Weierstrass in 1841 [15][Vol 2,page 123]. It was first introduced
in
connection with complex numbers. It is surprising that analysis advanced so
far
without introducing a special notation for this very important function.


Next: 6.2 Approximation
Up: 6. Limits of Sequences
Previous: 6. Limits of Sequences
Index
Ray Mayer
2007-09-07


![]() with
with ![]()

![]() , and all
, and all
![]()

![]() is smaller than
is smaller than ![]() is the interval
is the interval ![]() . Geometrically
this is clear from the picture.
. Geometrically
this is clear from the picture.

![]() ?
?
![]() be real numbers with
be real numbers with ![]() and
and ![]() .
.


![]() for absolute value of
for absolute value of ![]() was introduced by
Weierstrass in 1841 [15][Vol 2,page 123]. It was first introduced
in
connection with complex numbers. It is surprising that analysis advanced so
far
without introducing a special notation for this very important function.
was introduced by
Weierstrass in 1841 [15][Vol 2,page 123]. It was first introduced
in
connection with complex numbers. It is surprising that analysis advanced so
far
without introducing a special notation for this very important function.