

Next: 9. Trigonometric Functions
Up: 8. Integrable Functions
Previous: 8.5 Change of Scale
Index
8.51
Theorem.
Let  be a piecewise monotonic function from an
interval
 ![$[a,b]$](img1071.gif) to
to
 . Then
Proof: We already know this result for monotonic functions, and from this the result
follows easily for piecewise monotonic functions. 
Remark Theorem 8.51 is in fact true for
all integrable functions from ![$[a,b]$](img1071.gif) to
to
 , but the
proof is rather technical. Since we will never need the result
for functions that are not piecewise monotonic, I will not bother
to make an assumption out of it.
8.52
Theorem.
Let
 and let
![$f\colon
[a,b]\to\mbox{{\bf R}}$](img2208.gif) be a piecewise monotonic
function. Then
the graph of
be a piecewise monotonic
function. Then
the graph of  is a zero-area set.
Proof: We will show that the theorem holds when  is monotonic on
![$[a,b]$](img1071.gif) . It then follows easily that the theorem holds when
. It then follows easily that the theorem holds when  is piecewise
monotonic on
 ![$[a,b]$](img1071.gif) .
.
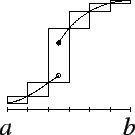
Suppose  is increasing on
 ![$[a,b]$](img1071.gif) . Let
. Let
 and let
 be the regular partition of
 ![$[a,b]$](img1071.gif) into
into  equal
subintervals.
Then
and
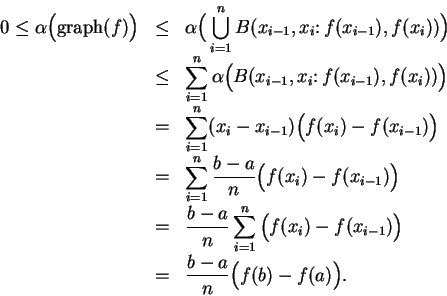
Hence
Now
 ,
so it follows from the squeezing rule that the constant
sequence
 converges to
  ,
and hence
Remark: Theorem 8.52 is actually valid
for all integrable functions on ![$[a,b]$](img1071.gif) .
.
8.53
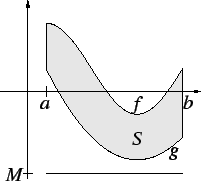
Theorem (Area between graphs.)
Let  be piecewise monotonic functions on an interval
 ![$[a,b]$](img1071.gif) such that
such that  for all
 ![$x\in [a,b]$](img1976.gif) . Let
Then
. Let
Then
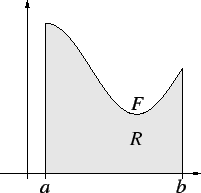
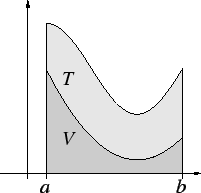
Proof: Let  be a lower bound for
  , so that
Let
for all ![$x\in [a,b]$](img1976.gif) , and let
, and let
Then
It follows from translation invariance of area that
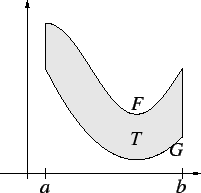
Let
Then  , and
, and
It follows from theorem 8.52 that  and
and  are almost
disjoint, so
and thus
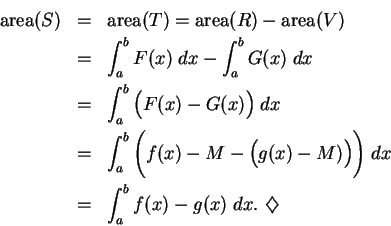
By theorem 8.51 we have
and
Thus
Remark: Theorem 8.53 is valid for all integrable
functions  and
and  . This follows from our proof and the fact that theorems
8.51 and 8.52 are both valid for all integrable functions.
8.54
Example.
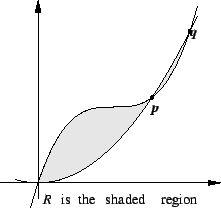
We will find the area of the set

in the figure, which is bounded by the graphs of

and

where
and
Now
Hence
It follows that the points

and

in the figure are
Also, since

for all
![$x \in [0,2]$](img2286.gif)
,
(This is clear from the picture, assuming that the picture is accurate.)
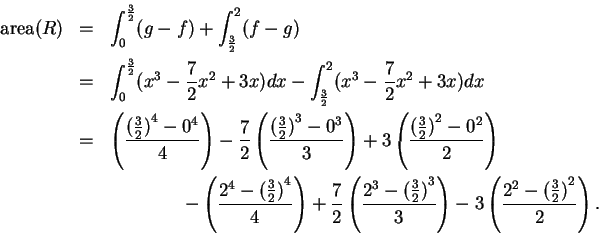
Thus
We have now found the area, but the answer is not in a very informative
form. It is not clear whether the number we have found is positive.
It would be reasonable to use a calculator to simplify the result,
but my experience with calculators is that I am more likely to make
an error entering this into my calculator than I am to make an error
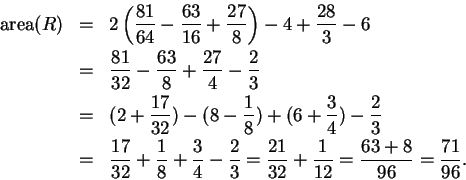
by doing the calculation myself, so I will continue. I notice that
three terms in the answer are repeated twice, so I have
Thus the area is about

From the sketch I expect the area to
be a little bit smaller than

, so the answer is plausible.
8.55
Exercise.
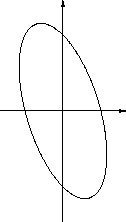
The curve whose equation is
 |
(8.56) |
is shown in the figure. Find the area enclosed by the curve.
(The set whose area we want to find is bounded by the graphs of the two
functions.
You can find the functions by considering equation (
8.56) as a quadratic
equation in

and solving for

as a function of

.)
A
8.57
Exercise.
A
Find the areas of the two sets shaded
in the figures below:
8.58
Exercise.
A
Find the area of the shaded region.


Next: 9. Trigonometric Functions
Up: 8. Integrable Functions
Previous: 8.5 Change of Scale
Index
Ray Mayer
2007-09-07
![]() to
to
![]() , but the
proof is rather technical. Since we will never need the result
for functions that are not piecewise monotonic, I will not bother
to make an assumption out of it.
, but the
proof is rather technical. Since we will never need the result
for functions that are not piecewise monotonic, I will not bother
to make an assumption out of it.
![]() is monotonic on
is monotonic on
![]() . It then follows easily that the theorem holds when
. It then follows easily that the theorem holds when ![]() is piecewise
monotonic on
is piecewise
monotonic on ![]() .
.
![]() is increasing on
is increasing on ![]() . Let
. Let
![]() and let
and let
![]() be the regular partition of
be the regular partition of ![]() into
into ![]() equal
subintervals.
equal
subintervals.

 ,
so it follows from the squeezing rule that the constant
sequence
![]() .
.
![]() be a lower bound for
be a lower bound for ![]() , so that
, so that


![]() and
and ![]() . This follows from our proof and the fact that theorems
8.51 and 8.52 are both valid for all integrable functions.
. This follows from our proof and the fact that theorems
8.51 and 8.52 are both valid for all integrable functions.
