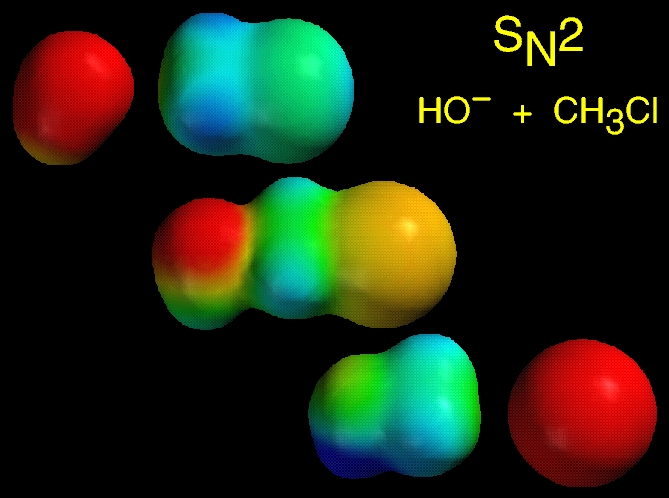
This figure shows electrostatic potential maps of the three "snapshots" shown on the preceding page. The top map shows that HO- begins the reaction as an electron-rich (RED) species, while the bottom map shows that by the end of the reaction Cl- is the most electron-rich species. The middle map shows that the negative charge in the "transition state" is delocalized over both O and Cl. The size of the red patch on O is shrinking (compare with top map) and the yellow color on Cl indicates that it has acquired a partial negative charge (compare to green color in top map and red color in bottom map). The "transition state", in fact, is more stable than the reactants because of this charge-delocalization, and the maps make the charge distribution obvious.
These maps provide yet another simple opportunity for me to ask follow-up questions that test student understanding. For example, this reaction does not have a barrier in the gas phase (an important fact that is never mentioned in the textbook), but it does have a barrier in solution. I can ask students to explain this phenomenon by first asking them to predict the relative hydrogen-bond acceptor ability of the anions (reactants, transition state, or product), then their relative aqueous solvation energies, and finally the effect these energies will have on the energy profile for the aqueous reaction coordinate.
This kind of detailed reasoning concerning subtle changes in hydrogen-bonding ability and solvation energies is facilitated by the use of models, and is a good introduction to the type of structure-activity relationships seen in biochemistry. Unfortunately, these concepts are largely ignored by the standard organic chemistry curriculum because it is hard to tackle them with standard formulas and Lewis structures.