Computer models provide the best tools for visualizing electronic structure. Many different tools can be used for this purpose, but my favorite one is the electrostatic potential map. This map shows two types of information: the size and shape of the molecule's electron cloud, and the interaction energy between the molecule and a positively charged ion resting on this cloud.
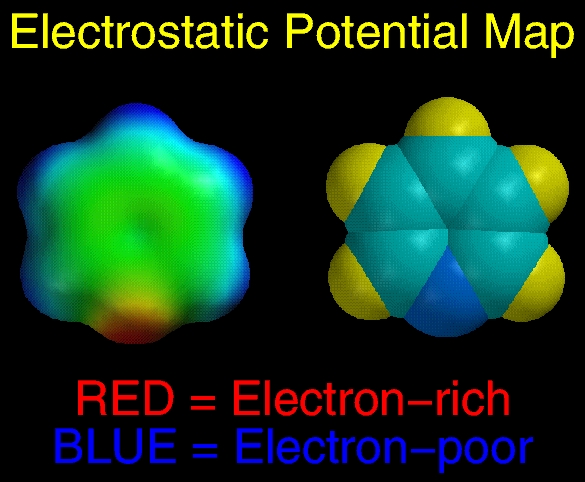
The above figure compares an electrostatic potential map and a space-filling model of pyridine, C5H5N. Both models have roughly the same shape and size. The map is also color-coded according to the electrostatic potential. Regions that repel a positive ion the most (usually electron-poor) are BLUE. Regions that attract a positive ion the most (usually electron-rich) are RED. Intermediate potentials are colored according to the color spectrum. Looking at pyridine we see that the five hydrogens are the most electron-poor atoms (BLUE) and the region around the nitrogen lone pair (RED, bottom of map) is especially electron-rich. The face of the ring is not as electron-rich as the lone pair.