Applets/Java
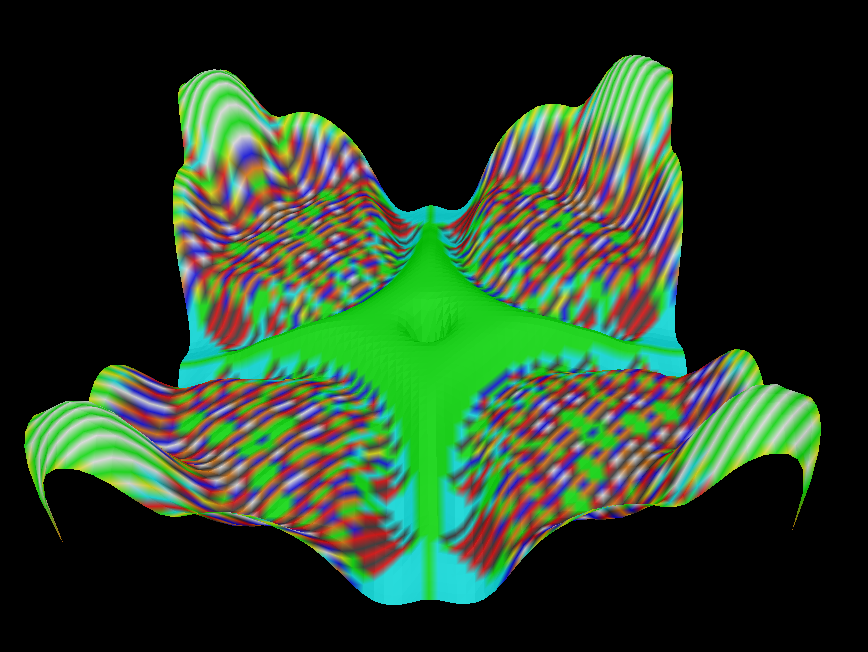
As a 2009 Google Summer of Code project, Bryan Head created a sandpile application for displaying and analyzing the Abelian Sandpile Model on finite directed multigraphs. His mentor was Reed College professor, David Perkinson, and the mentoring institution was Portland State University. The pictures to the right are snapshots of the program in action.Online Applet. An early online version of the program appears here. Depending on your computer system, it may crash the browser, the window may not open, or it might even work. Problems are likely with IcedTea java. If the applet loads, hit Run for a spectacular display!
Main Program. The main program is much more versatile. It includes the following features:
- Cross-platform.
- Flexible graph editing environment for the creation of arbitrary weighted digraphs.
- Built-in support for generating common graphs, such as lattices and honeycombs.
- Flexible configuration editor to create, save, and add together arbitrary configurations.
- Built-in support for common configurations such as:
- Identity
- Minimal Burning
- Inverse
- Max Stable
- Random
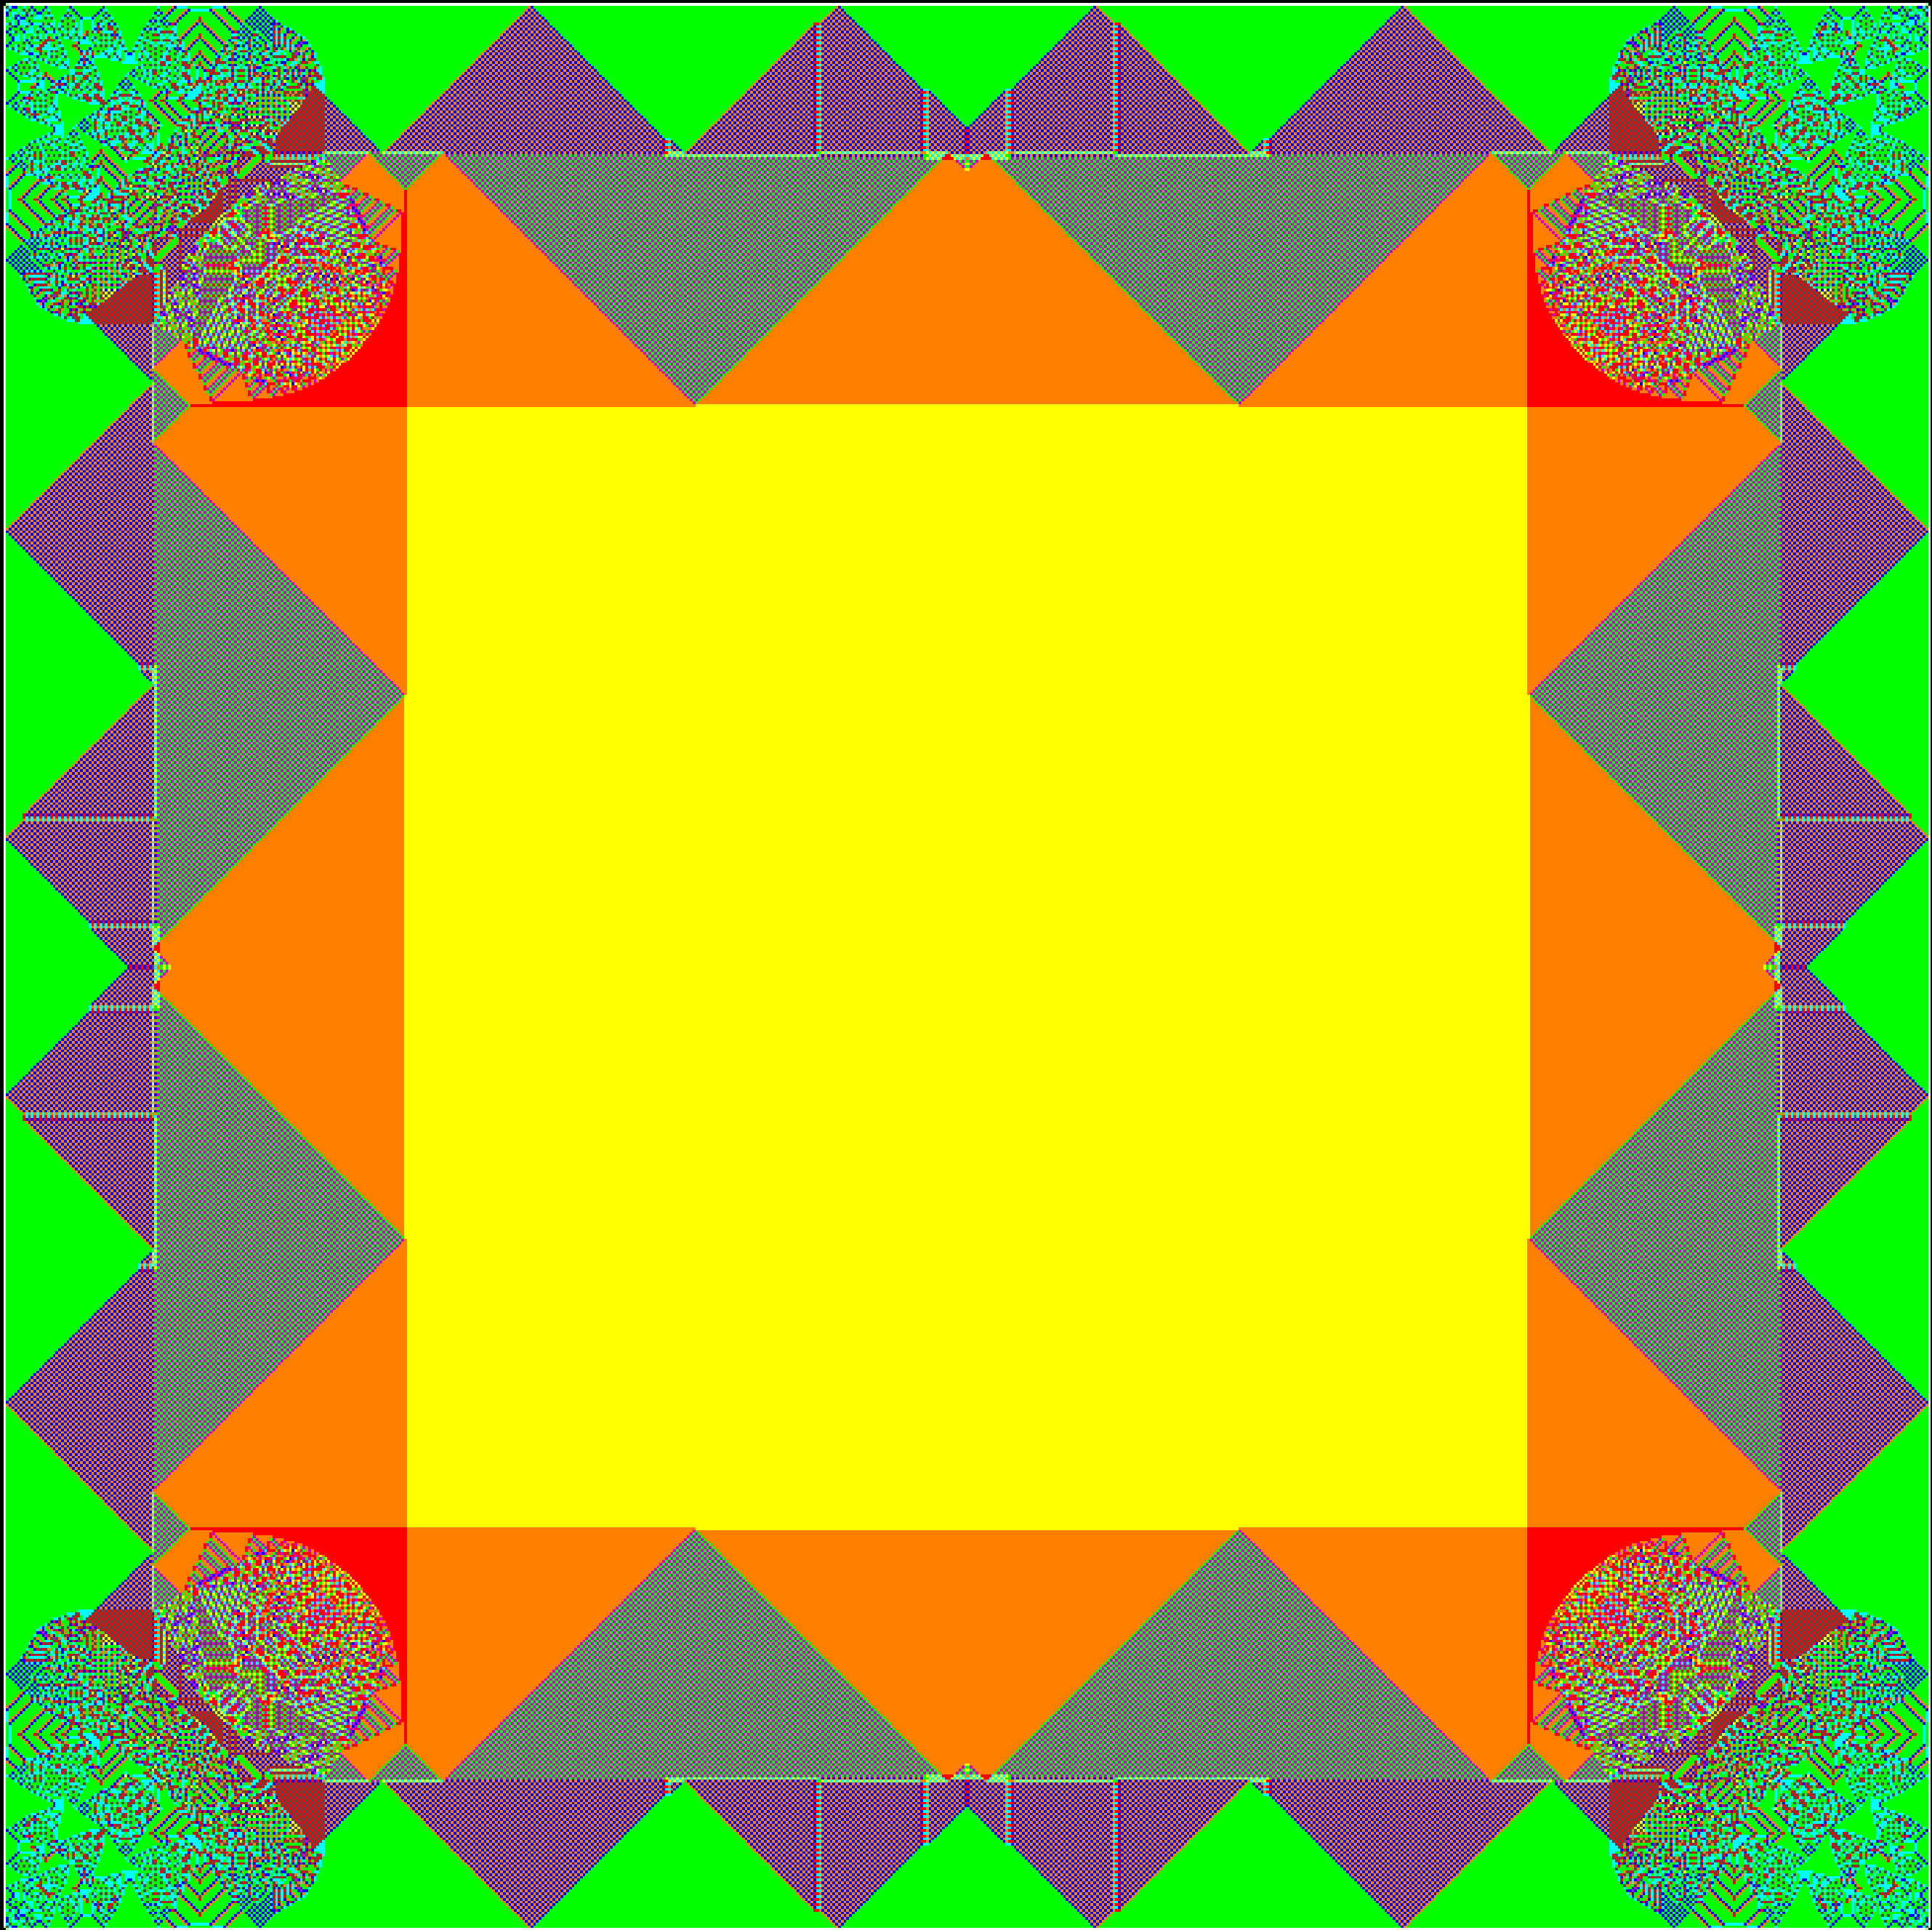
- Multiple visualization modes including:
- Number of grains
- Stability
- Total Firings (useful for viewing avalanches)
- Change in number of grains
- 3D display mode
- Uses height and color smoothing to reveal higher level structure.
- OpenGL for fast rendering
- Fast parallel update algorithm
- Allows for remote connection from other programs for parallel methods of analysis.
- Python and Sage bindings
- Enables flexible statistics collection
- Enables the simulation of general algorithmically generated graphs.
- Takes advantage of graph adjacency structure to decrease memory footprint and increase performance.
Download. To download the latest version of the program click on one of the links below. (Alternatively, go to the program's github repository and hit the download button.) After unzipping or untarring, change into the directory matching your system and double-click on SandpilesApp.jar or issue the command java -jar SandpilesApp.jar. Linux users may need to add the current directory to the library path for java: export LD_LIBRARY_PATH=$LD_LIBRARY_PATH:., including the trailing period. (One could also add the full path to the SandpilesApp.jar directory.).
More information about the program can be found at its wiki. Please write if you need help.
| DOWNLOAD LINKS |
|---|
First Example. Having started SandpilesApp.java as explained above, try the following:
- Click on the
Make Gridtab.- Click in the display window (black square) to place the grid. (You can click-and-drag the grid.)
- Click on the
Config Managertab.- Click on
Max Stableand click theAddbutton to add 3 grains of sand to each vertex of the grid.- Click on
Ones EverywhereandAddso that there are now 4 grains of sand on each vertex. Hence, every vertex is unstable.- Click on
Runto start the stabilization process.- To see the sandpile in 3 dimensions, click on the
Visual Optionstab (you may need to scroll the tabs by clicking on an arrow if the tabs are not all displayed at once). Then click the3dbutton. (The first time the button is pressed, there is a delay while a triangulation is calculated.) I would suggest settingColor Smoothingto 0 andHeight Scalarto 6. You can grab and reorient the sandpile to change the viewpoint.- Note: to create new graphs, make sure you are in 2d mode.
sage: %runfile SandpileRemote.py
to get started. (You may need to give the full path to 'SandpileRemote.py.) Within the Sandpiles application, hit the "Server" button and press 'yes'. The Sandpile application will inform you of the connection. Then, from Sage, create an instance of the SandileRemote class and connect to the program:
sage: srem = SandpileRemote()
sage: srem.connect()